Economic Intelligence Dashboard
From data chaos to decision-ready insights—consolidating economic indicators and market intelligence in one platform
The Challenge
Real estate investors and market analysts face information fragmentation every day. Making informed investment decisions requires tracking:
- •Federal Reserve economic indicators across 5+ different datasets
- •Real estate market newsletters delivered to email inboxes
- •Housing market data from government websites
- •Regional banking and employment statistics
- •Market news and real estate deal announcements
Investors were jumping between Bloomberg terminals, FRED websites, email newsletters, and various data providers—spending 5+ hours per week just gathering and organizing information. This fragmentation led to missed opportunities, incomplete analysis, and decision fatigue.
The Solution
We built a comprehensive economic intelligence platform that consolidates data from multiple government APIs, automatically parses real estate newsletters, and presents everything in an intuitive, organized dashboard. Investors now have all the information they need in one place.
Key Features
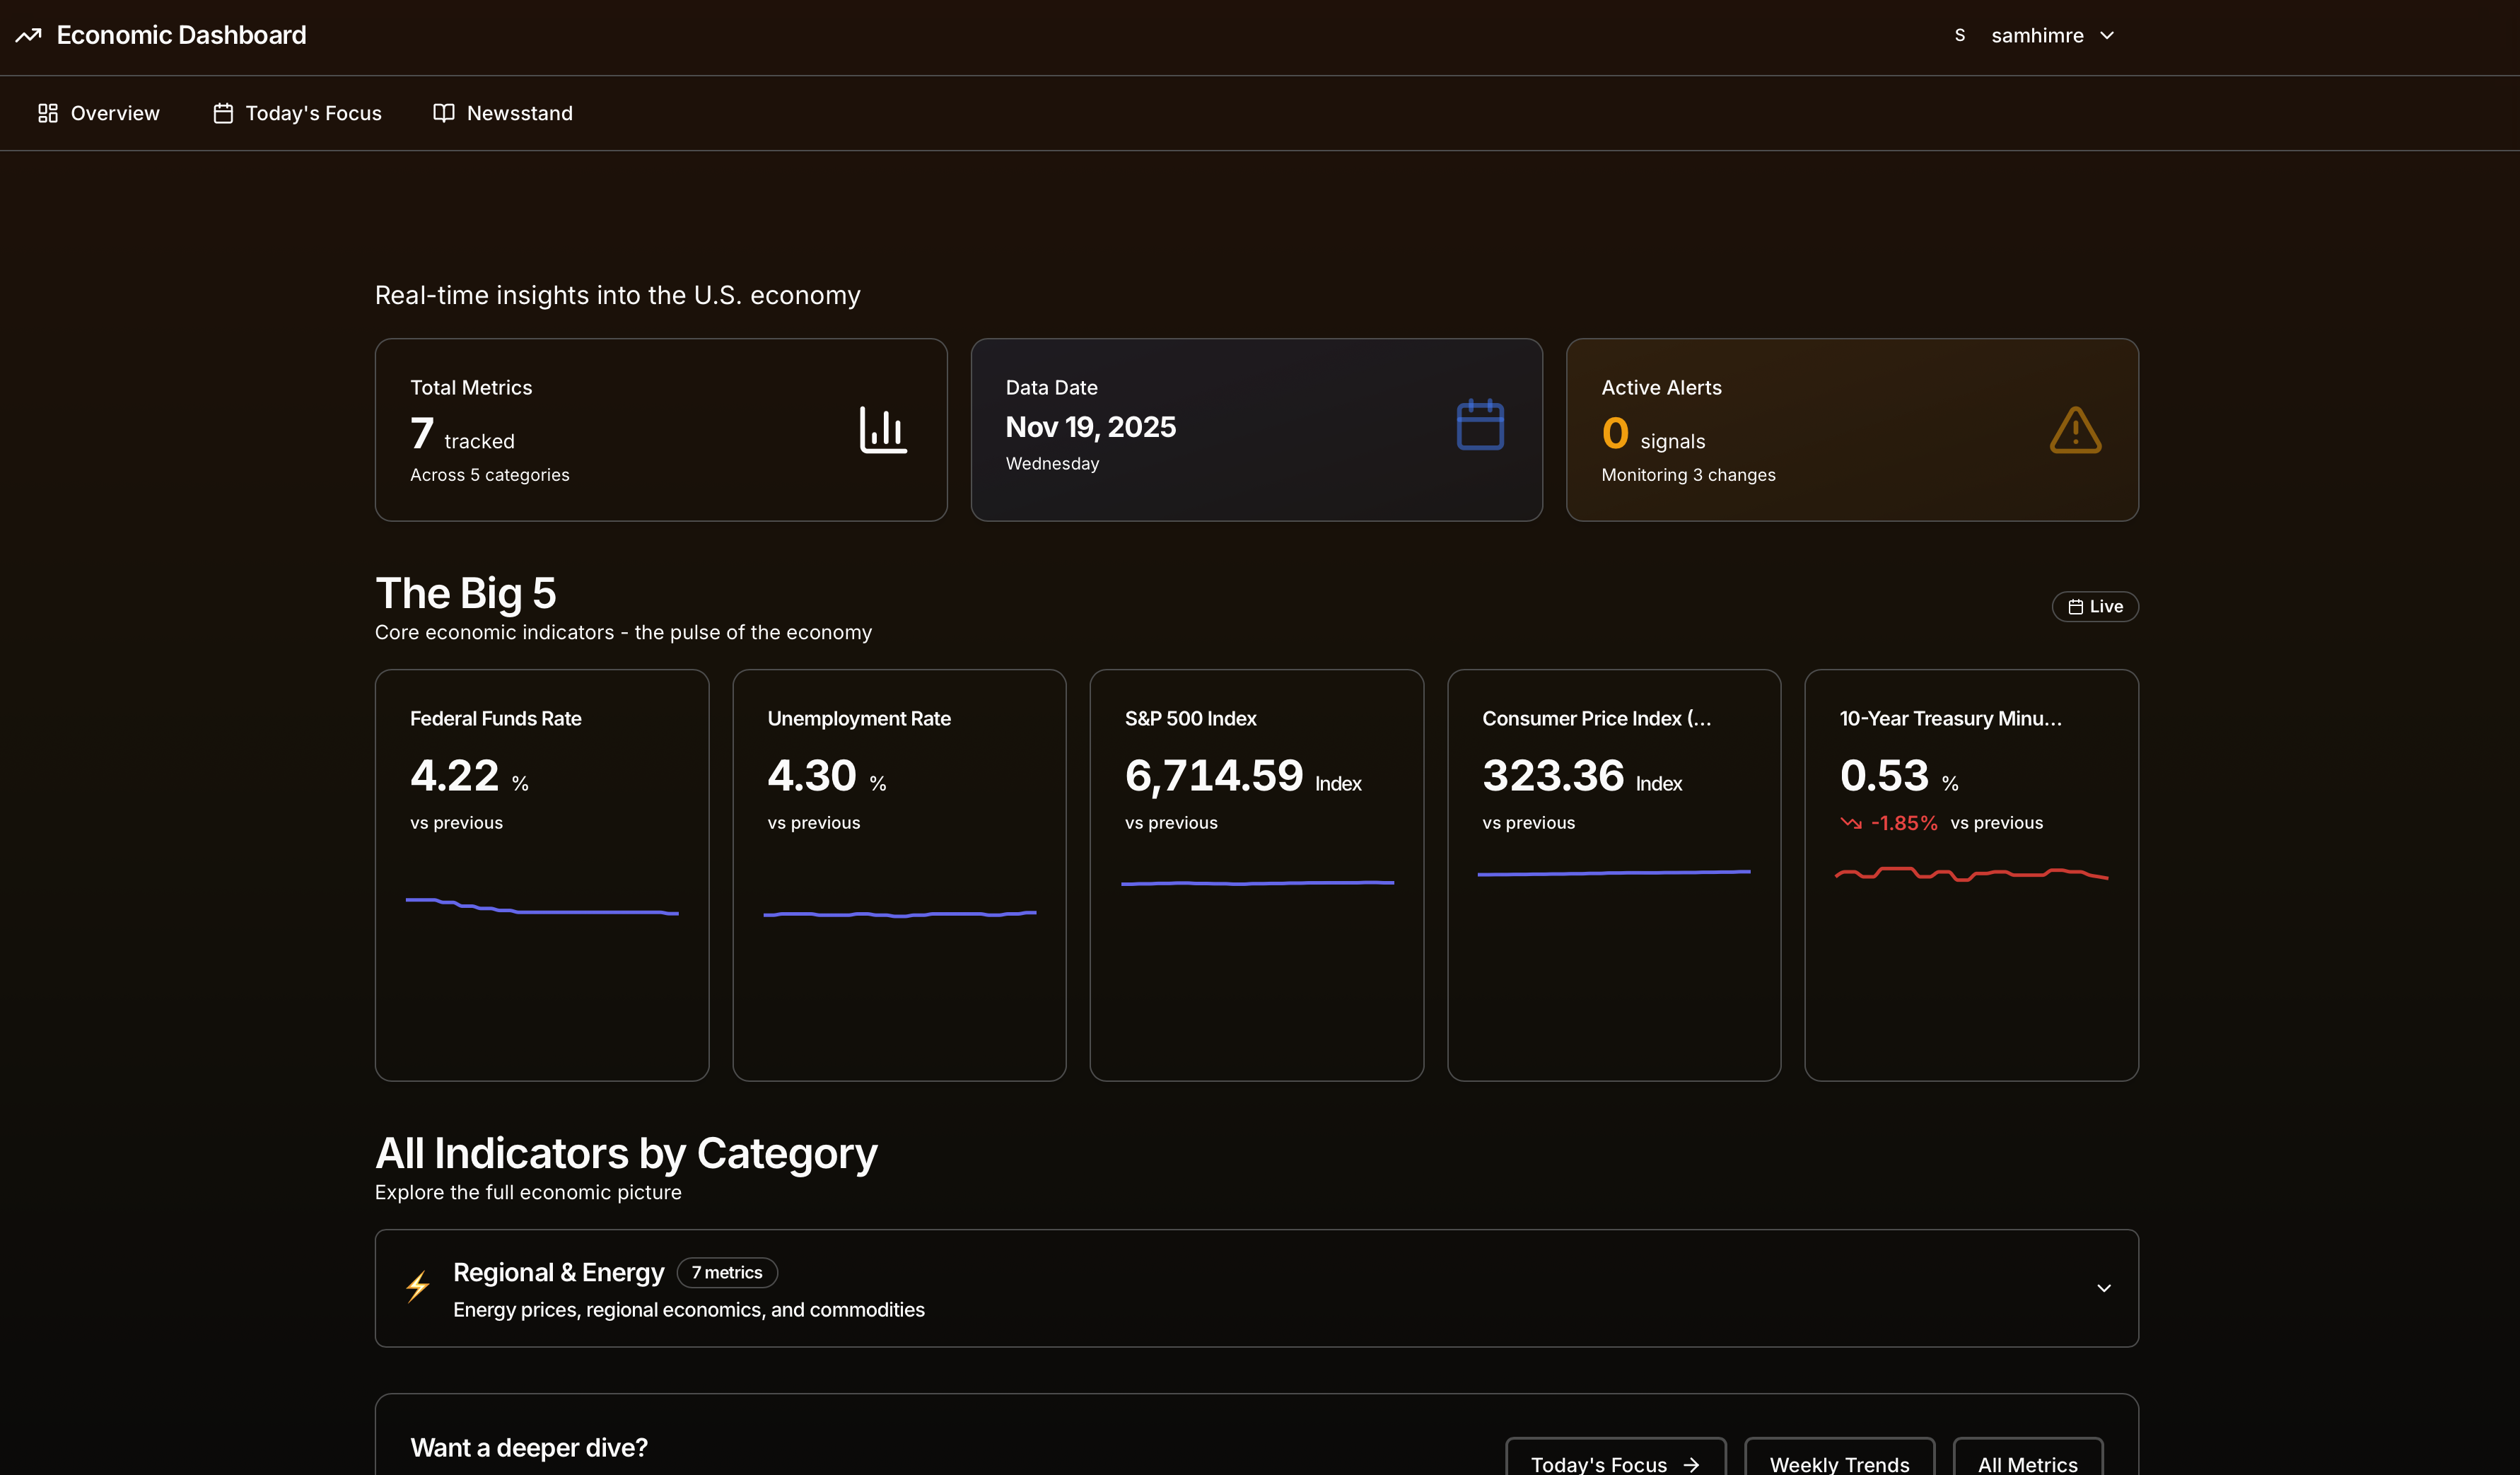
39+ Economic Metrics
Real-time data from Federal Reserve (FRED), BEA, and BLS including rates, housing, inflation, and employment.
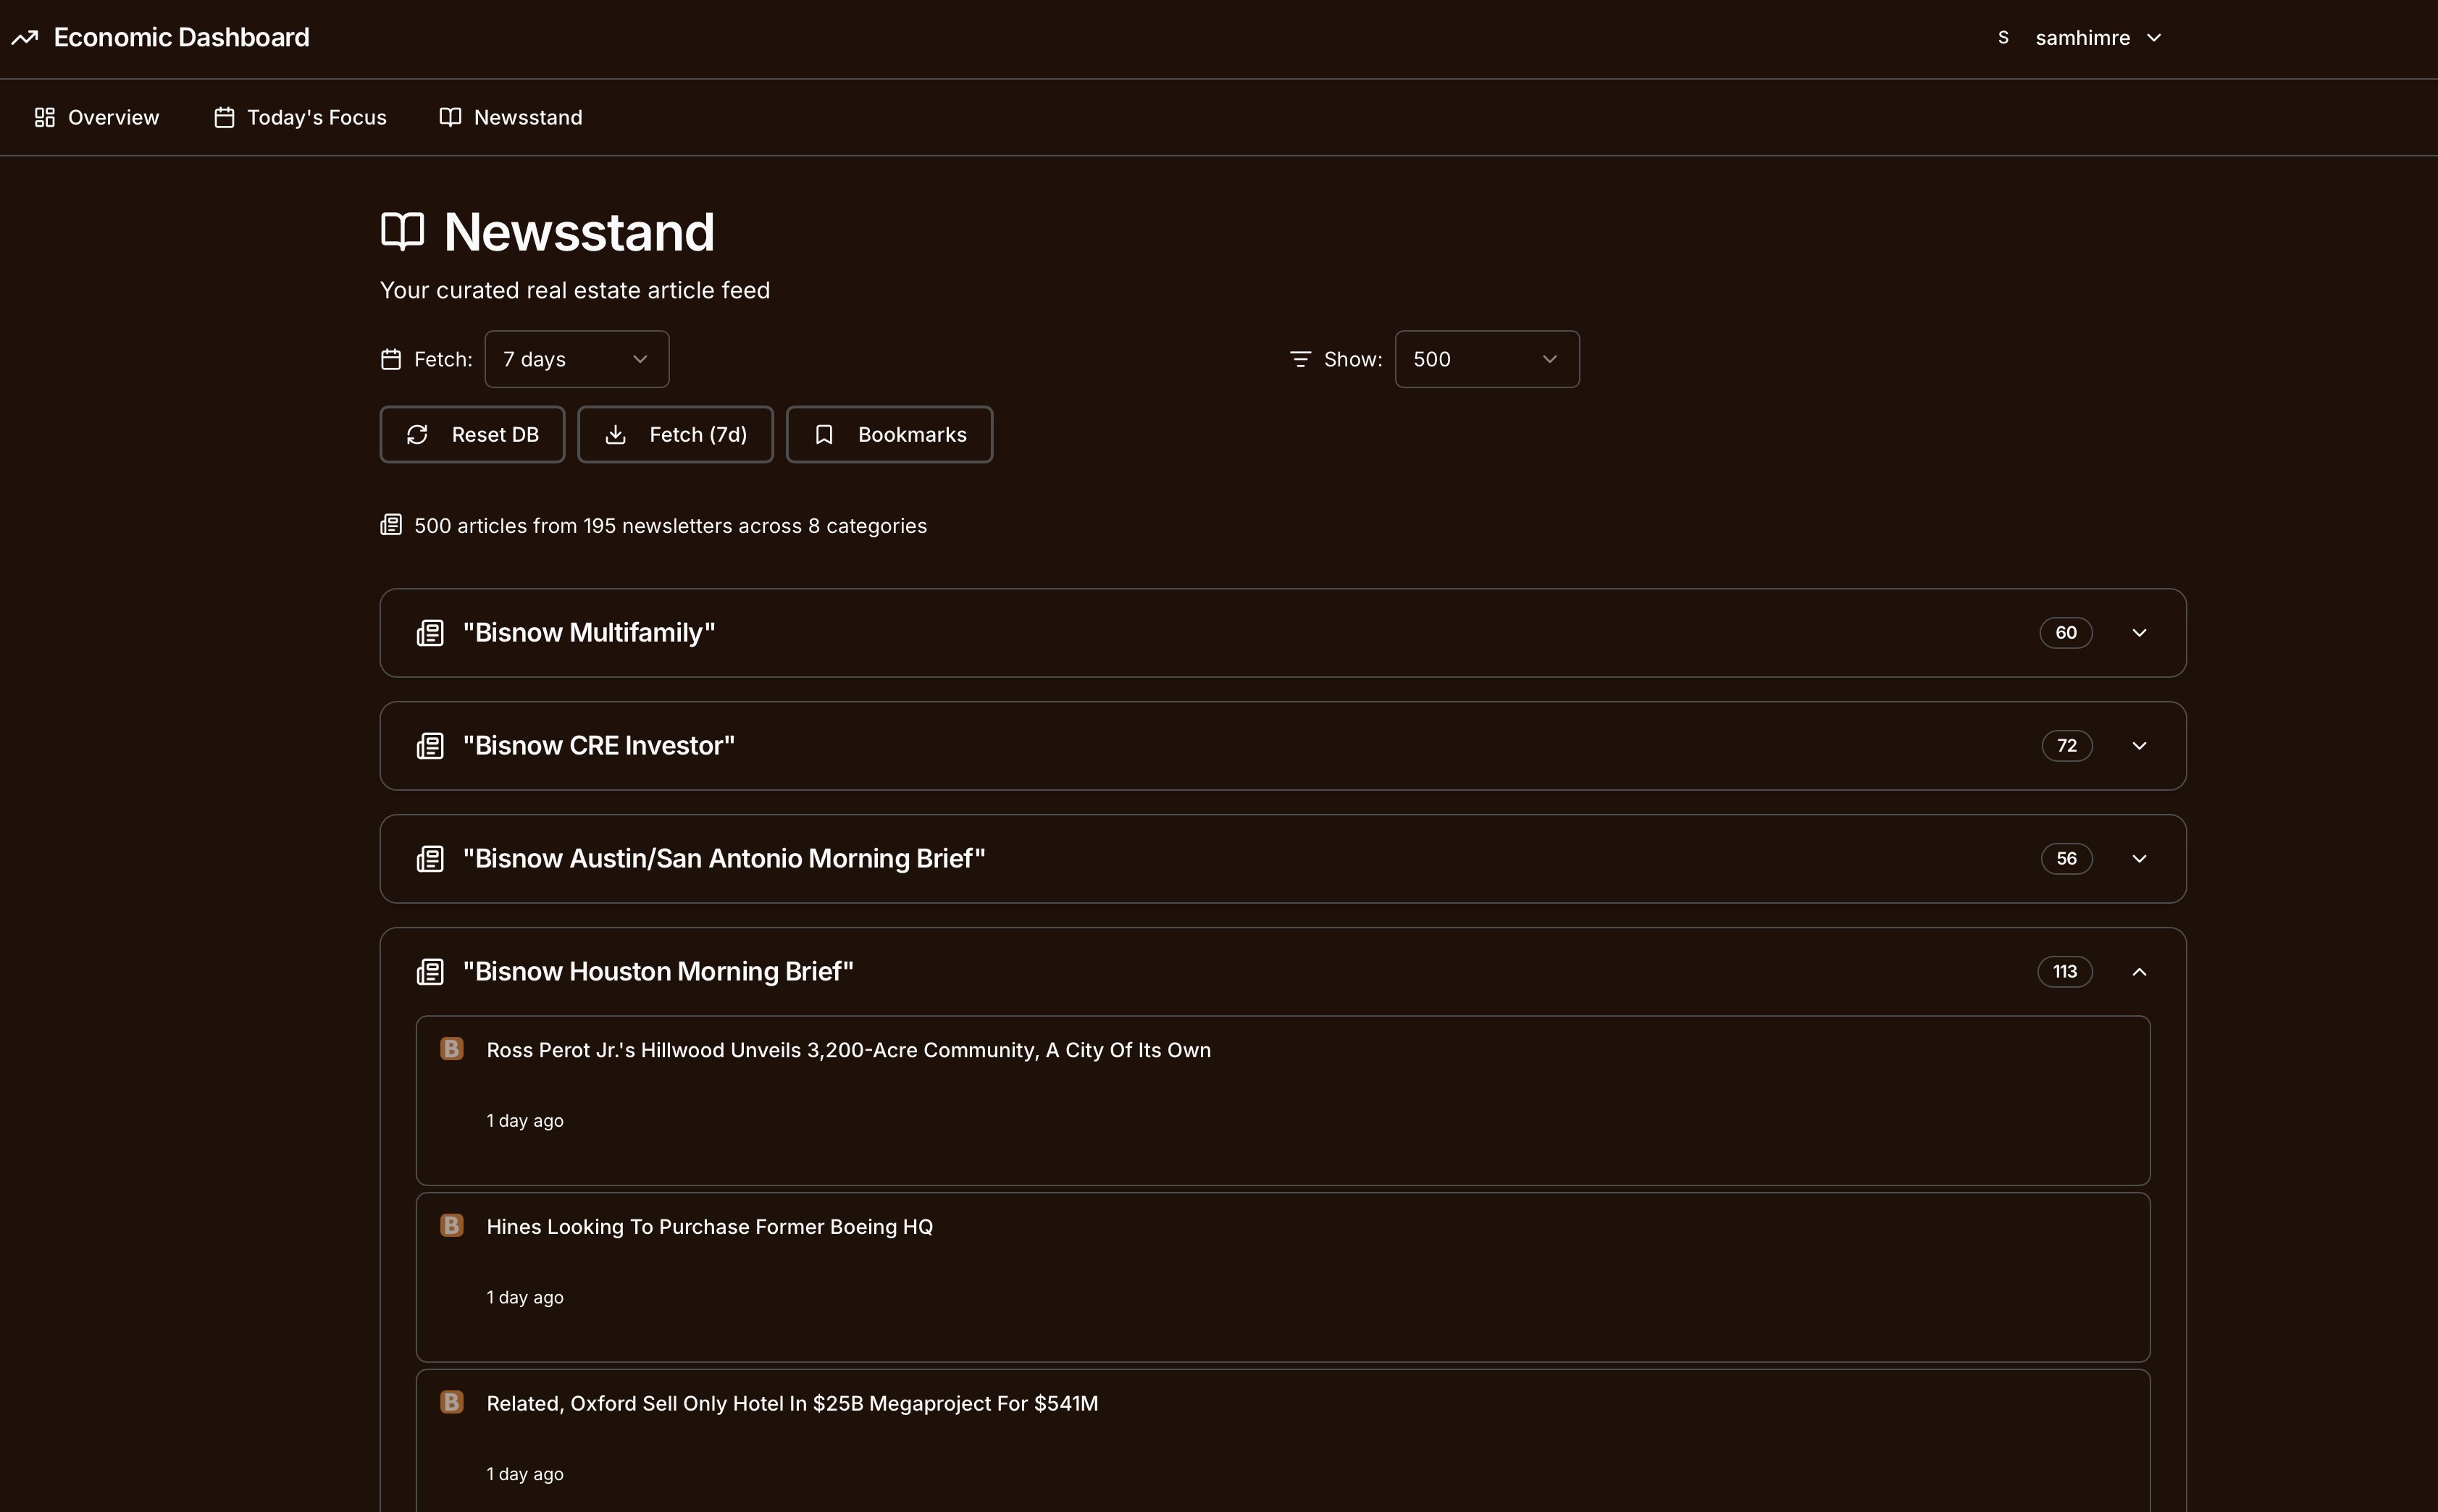
Automated Newsletter Parsing
Connects to email inbox, extracts real estate news from Bisnow newsletters, and organizes articles by category.
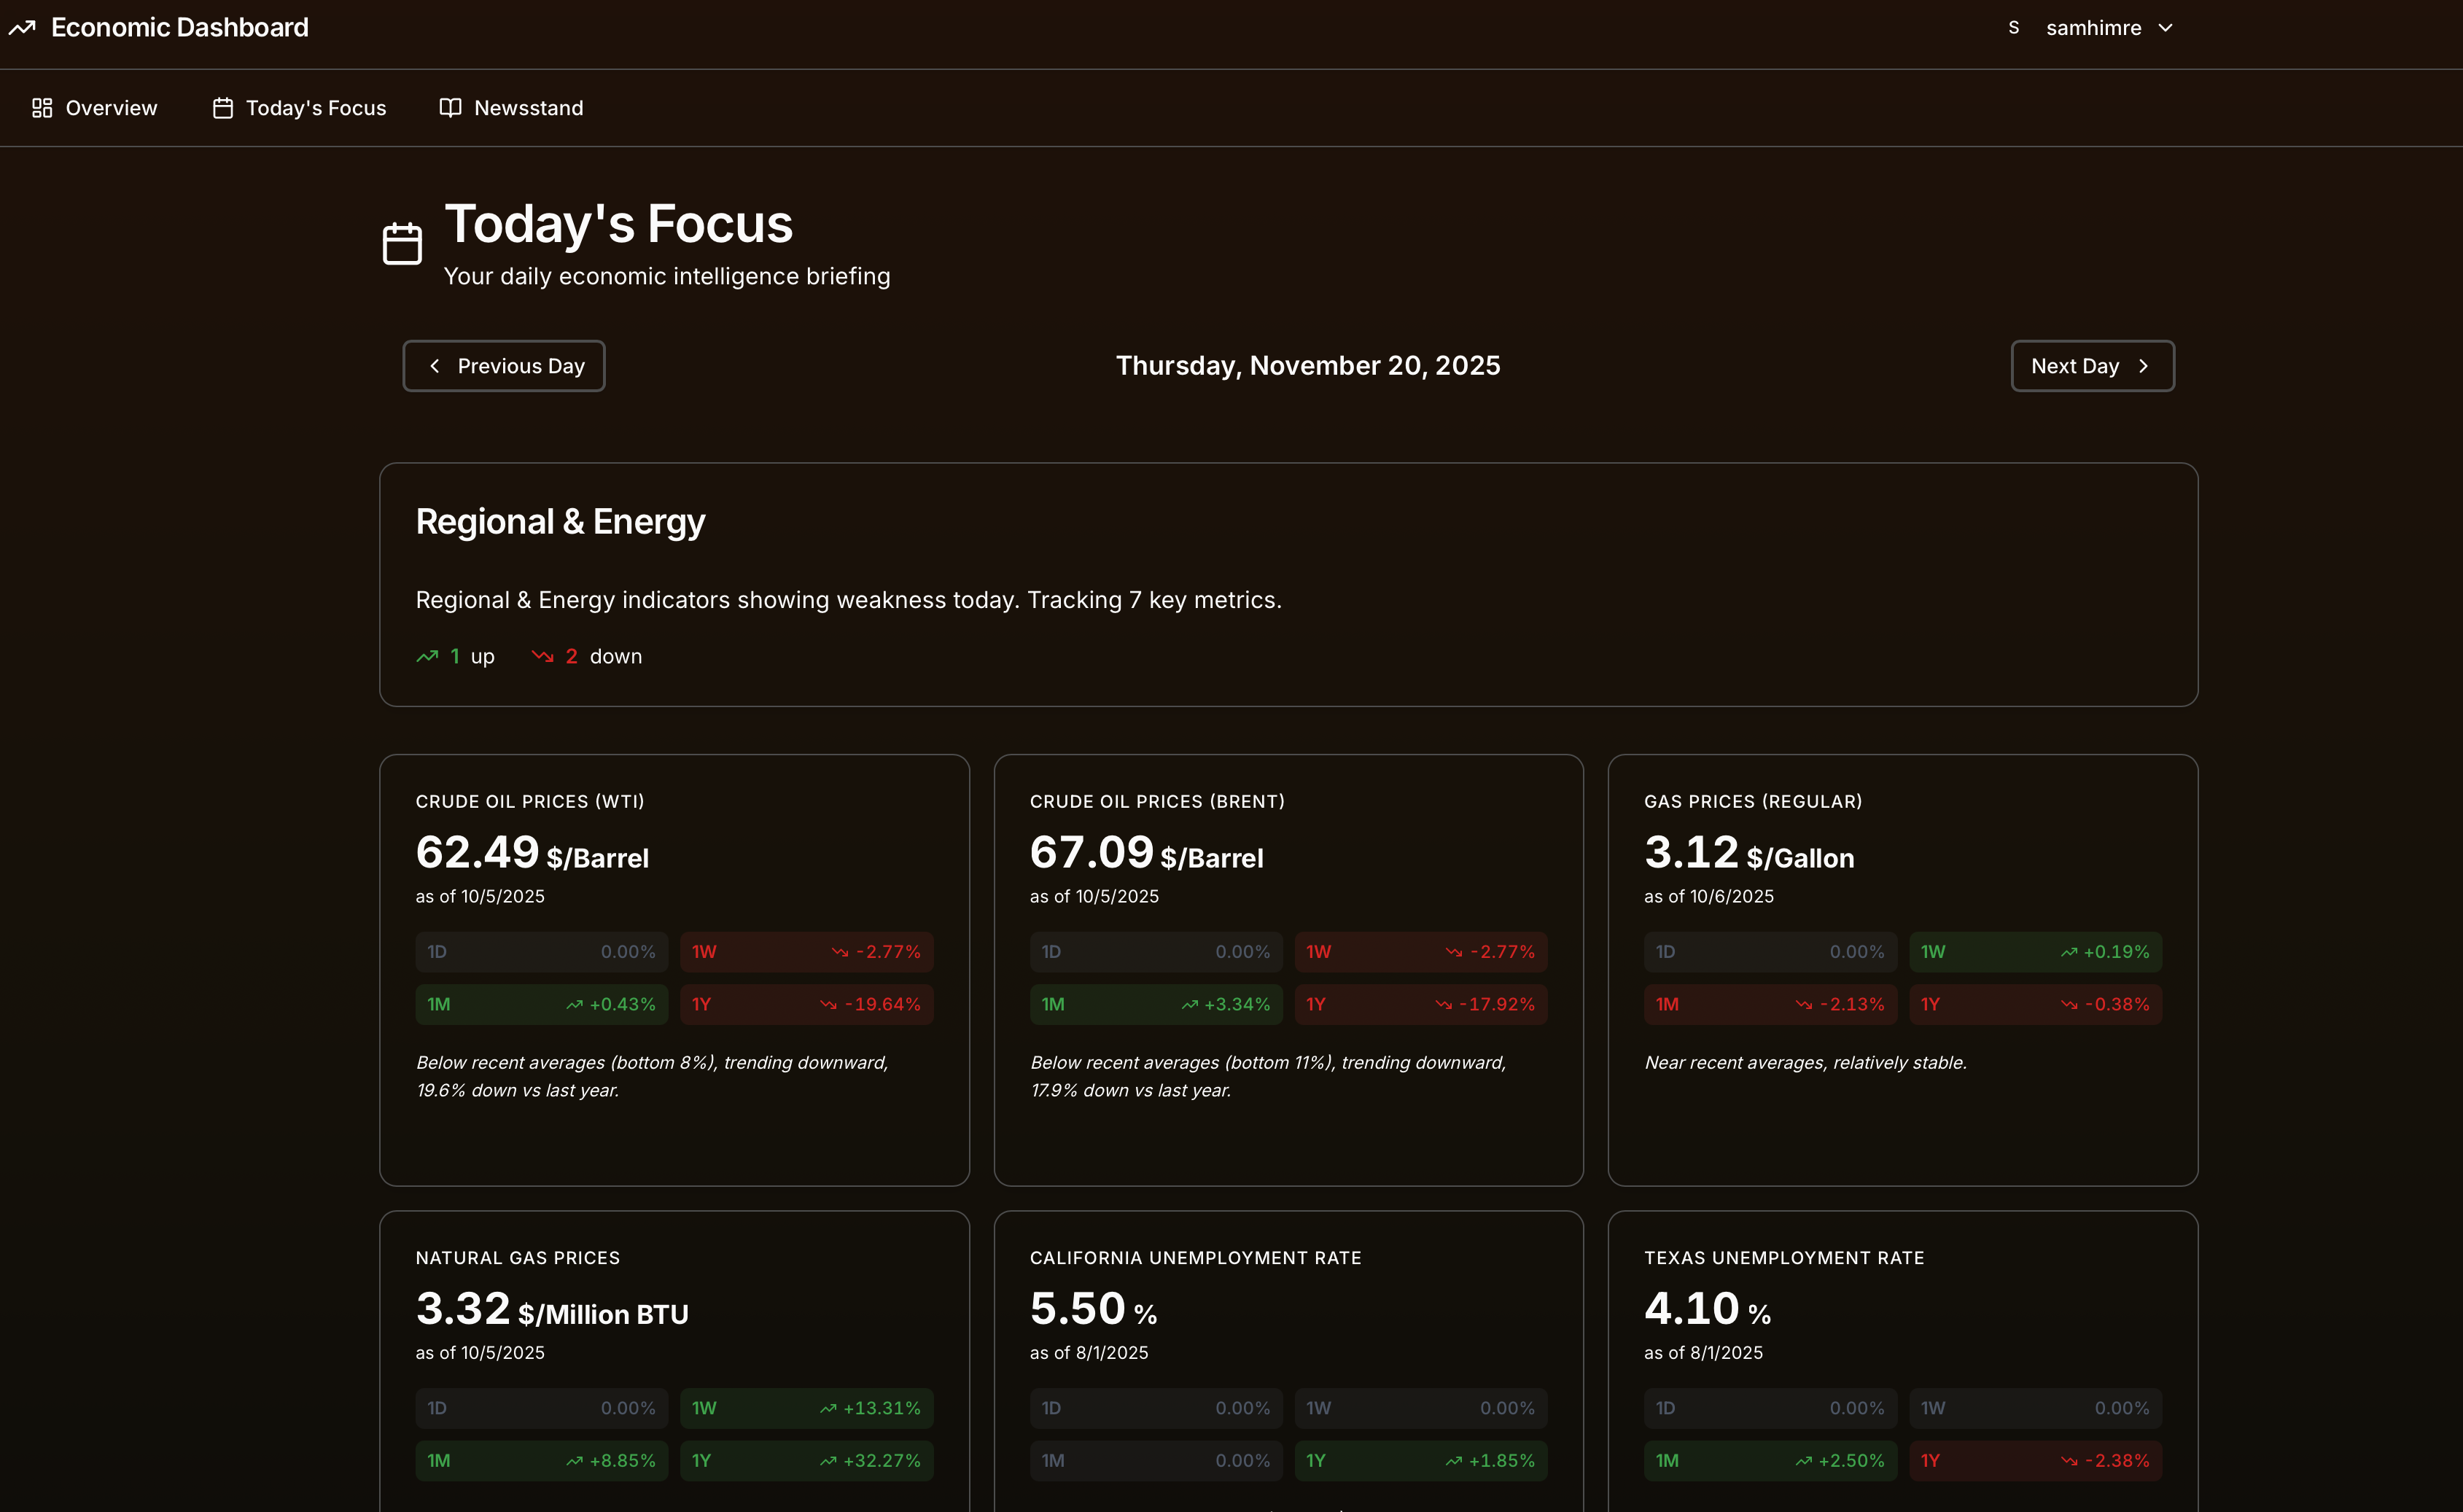
"Today's Focus" Educational Feature
Daily themes organize metrics by topic (Mondays: Interest Rates, Tuesdays: Real Estate, etc.) for progressive learning.
Personal Bookmarking System
Create custom bookmark lists to organize articles by topic, track deals, or save market opportunities.
Interactive Data Visualization
5-year historical charts with multiple time ranges, trend analysis, and contextual insights.
Smart Metric Extraction
Automatically extracts cap rates, deal values, square footage, and prices from newsletter articles using regex patterns.
How It Works
Data aggregation: Backend services automatically fetch economic data from FRED, BEA, and BLS APIs on a scheduled basis (daily, weekly, or monthly depending on the metric).
Newsletter parsing: Email integration connects to Gmail via IMAP, fetches Bisnow newsletters, and uses BeautifulSoup to extract individual articles from HTML emails.
Intelligent organization: Articles are categorized, deduplicated, and analyzed for key metrics (cap rates, deal sizes, etc.) using regex patterns.
Unified dashboard: React frontend presents everything in one place—charts for economic data, organized article feeds, and personal bookmarks.
The Results
By consolidating fragmented data sources into one platform, we transformed the investment research workflow:
- ✓Investors access all economic data in seconds instead of hours
- ✓Real estate newsletters automatically parsed and organized by category
- ✓Historical context helps identify trends and outliers quickly
- ✓Personal bookmarking system keeps track of opportunities and important articles
- ✓"Today's Focus" feature provides educational progression for learning economics
Technical Implementation
Technical Implementation
Architecture
Frontend
- • React 19.1 with TypeScript for type safety
- • Vite build tool for fast development
- • Shadcn/ui components (Radix UI + Tailwind)
- • Recharts for data visualization
- • Zustand for state management
- • Deployed on Cloudflare Pages
Backend
- • FastAPI (Python 3.11+) for high-performance API
- • PostgreSQL database with AsyncPG
- • Redis caching for performance
- • APScheduler for periodic data fetching
- • SQLAlchemy 2.0 ORM with async support
- • Deployed on Railway.app with auto-scaling
Data Integrations
- • FRED API (Federal Reserve Economic Data) - 39+ metrics
- • BEA API (Bureau of Economic Analysis) - Regional data
- • BLS API (Bureau of Labor Statistics) - Employment data
- • Gmail IMAP for newsletter fetching
- • BeautifulSoup 4 for HTML email parsing
Key Features
- • Smart caching: Redis caches API responses to prevent quota exhaustion
- • Rate limiting: 120 requests/minute with retry logic
- • Metric extraction: Regex patterns extract cap rates, deal values, square footage from articles
- • Duplicate detection: Prevents redundant articles in the database
- • Responsive design: Mobile-first approach with information density gradients
- • Dark mode: Glassmorphism effects with backdrop filters
Database Schema Highlights
- • FredDataPoint: Economic metrics with composite indexes
- • Article: Individual news items extracted from newsletters
- • Newsletter: Email container with metadata
- • BookmarkList: User-created collections (max 10 per user)
- • Normalized schema: Foreign key relationships with CASCADE delete
Drowning in data from multiple sources?
We specialize in consolidating fragmented information into unified dashboards. Let's talk about your workflow and how we can streamline it.
Start Your Project